Executive Summary
Inflation systematically erodes purchasing power over time, making real returns (nominal return minus inflation) the true measure of investment success. This brief explains inflation's mechanics, demonstrates its long-term impact through practical examples, and provides actionable strategies to build portfolios that preserve and grow wealth in real terms.
Inflation represents one of the most significant yet overlooked risks to long-term wealth preservation. At 6% annual inflation, purchasing power halves approximately every 12 years, meaning investors must achieve at least 6% nominal returns just to maintain wealth in real terms. Most fixed-income investments fail to provide adequate inflation protection after taxes, creating a "wealth erosion trap" for conservative investors who prioritize safety over growth.
Understanding Inflation's Impact
What is Inflation?
Inflation is a sustained increase in the general price level of goods and services in an economy over time. Practically, it reduces how much a fixed sum of money can purchase, making inflation-adjusted returns the only meaningful measure of investment performance.
Simple Example
Grocery basket: A ₹1,000 basket at 5% inflation costs approximately ₹1,276 after 5 years (1,000 × 1.05⁵).
The Rule of 72
The Rule of 72 provides a quick mental calculation to estimate how long it takes for an amount to double at a constant annual rate: Years ≈ 72 ÷ Annual Rate(%).
Purchasing Power Erosion: ₹1 Crore Example
| Time Horizon | Future Cost | Purchasing Power |
|---|---|---|
| 10 Years | ₹1.79 Crore | ₹55.8 Lakh |
| 20 Years | ₹3.21 Crore | ₹31.2 Lakh |
| 30 Years | ₹5.74 Crore | ₹17.4 Lakh |
If inflation averages 6% annually, an item costing ₹1 crore today will require approximately ₹1.79 crore in 10 years and ₹3.21 crore in 20 years. Conversely, holding ₹1 crore as cash would see its purchasing power decline to what ₹55.8 lakh buys today in 10 years, and just ₹31.2 lakh in 20 years.
The two columns in the table provide complementary insights: the future cost column shows how much money will be needed to maintain current lifestyle, while the purchasing power column demonstrates why cash holdings systematically lose value. This dual perspective is essential for proper financial planning, as it highlights both the savings target needed and the risk of conservative asset allocation.
Inflation Trends & Analysis
Consumer Price Index (CPI) measures changes in the price level of a basket of consumer goods and services.
CPI volatility reflects both domestic factors (monsoon, supply chains) and global influences (commodity prices, exchange rates). The recent moderation suggests effective monetary policy, but structural factors like climate change and geopolitical tensions may sustain inflationary pressures long-term. Investors should plan for inflation averaging 5-6% over decades rather than focusing on short-term fluctuations.
Investment Performance vs Inflation
Comparison of nominal annual returns across asset classes. The dashed line represents 5% inflation reference.
Only equity investments (mutual funds and direct equities) have consistently delivered meaningful real returns after inflation and taxes. Fixed income instruments often provide minimal or negative real returns, making them unsuitable as primary wealth-building vehicles. The inflation-beating potential of equities comes with higher volatility, requiring appropriate time horizons and risk tolerance.
Investment Strategy & Implementation
Asset Class Comparison
| Instrument | Nominal Return | Inflation Protection | Practical Notes |
|---|---|---|---|
| Bank Fixed Deposits | 6–7% | Low | Taxable; may deliver near-zero real return after tax with 4–6% inflation |
| Short-duration Debt Funds | 6–8% | Low | Better liquidity and tax efficiency than FDs |
| Conservative Hybrid Funds | 7–10% | Moderate | Balanced medium-term solution with some equity exposure |
| Equity Mutual Funds (SIP) | 10–14% | High | Core growth engine for 7+ year horizons; rupee cost averaging benefits |
| Direct Equities (Quality) | 12–20%+ | High | Highest potential but requires research and risk management |
Investment Checklist
- Emergency Fund: Maintain 3–6 months of expenses in liquid instruments
- Core Growth: Diversified equity SIPs for long-term goals (7+ years)
- Medium-term Allocation: Short-duration debt / conservative hybrids
- Realistic Modeling: Use after-tax, after-inflation assumptions
- Regular Rebalancing: Annual portfolio review and adjustment
- Inflation Monitoring: Update assumptions after economic shocks
Inflation in Practice: Visual Examples

Historical small-ticket prices illustrating cumulative inflation for discretionary items and services over time.
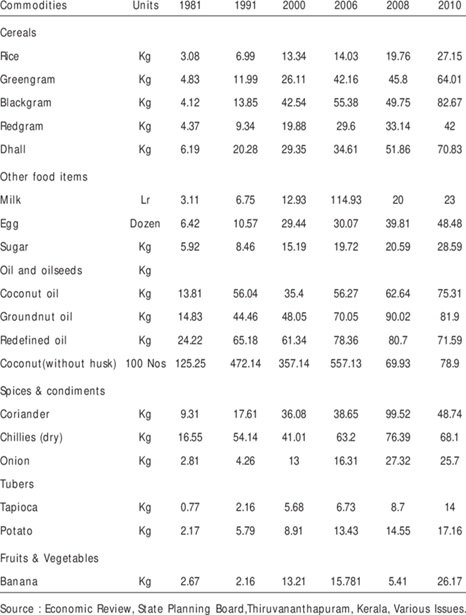
Demonstrates regional and commodity drivers of inflation—essential for tailoring household-level assumptions.
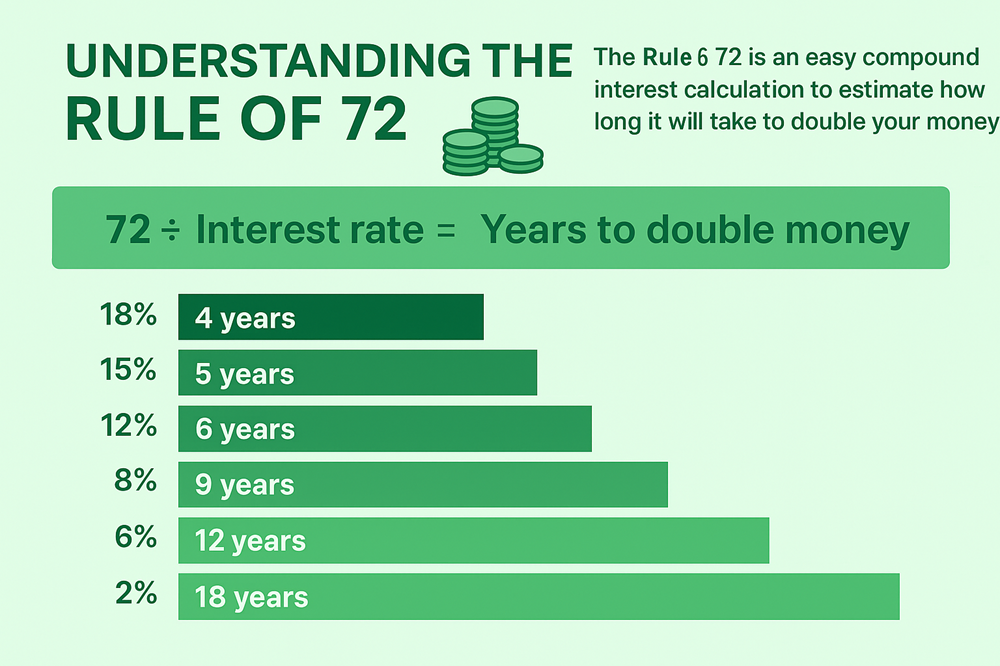
Visual reference for understanding how different return rates affect wealth doubling time and inflation impact.

Staple price series that help calibrate conservative inflation scenarios for household budget planning.
Conclusion & Action Plan
- Model all financial goals using after-tax, after-inflation return assumptions
- Use diversified equity SIPs as the core long-term growth engine (7+ year horizon)
- Allocate to debt instruments primarily for short-term needs and emergency funds
- Rebalance portfolios annually and review inflation assumptions after major economic events
- Focus on real returns (nominal returns minus inflation) as the true measure of investment success
Inflation represents the silent partner in every investment decision—one that consistently works against wealth preservation. Successful long-term investing requires not just beating inflation, but doing so after accounting for taxes and investment costs. A disciplined approach combining equity exposure for growth, periodic rebalancing for risk management, and realistic inflation expectations provides the foundation for achieving meaningful real returns over time. Investors who understand and proactively address inflation's erosive effects position themselves for true wealth creation rather than nominal wealth preservation.